Bitcoin’s current $57,123 price shows a 1.79% daily drop but a 5.31% weekly rise, but a rally to $61K is important.
- Per analysts, Bitcoin needs a 3.5% rally to close above $60,600, which will help reclaim its crucial re-accumulation range.
- Historical patterns suggested that Bitcoin’s price could reach around $65,000, following established cyclical behaviors.
Bitcoin [BTC] has experienced varied price movements recently, with its price standing at $57,123.74 at press time, per CoinGecko. This marked a 1.79% decline in the past 24 hours but a 5.31% increase over the past week.
Rekt Capital, a well-known analyst, stated that Bitcoin needs to rally an additional 3.5% to close above $60,600 for a weekly candle close to reclaim the range low.
This level is crucial for Bitcoin to re-enter its re-accumulation range, which has historically led to price increases.
The trading volume for Bitcoin was $28,605,062,745 at press time, highlighting the intense market activity.
Analysts observed that Bitcoin’s price movements and volume trends were critical indicators for traders in understanding potential future directions.
Historical and predicted trends
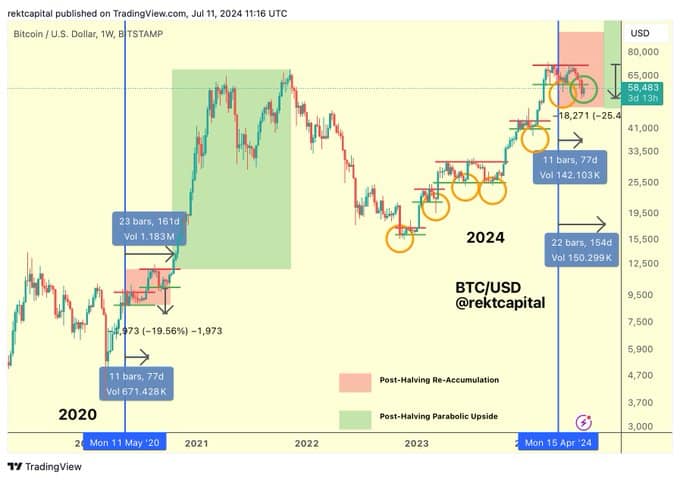
Rekt Capital’s analysis of Bitcoin’s historical performance from 2020 to 2024 indicated clear patterns following the halving events.
On the 11th of May 2020, Bitcoin underwent a halving event, which was followed by an 11-week re-accumulation phase where the price dropped by 19.56%.
Subsequently, Bitcoin entered a parabolic upside phase lasting 23 weeks and 161 days, reaching a peak volume of 1.183M.
In 2024, the chart projected similar trends with an 11-week re-accumulation phase, involving a volume of 142.103K, and a predicted parabolic upside over 22 weeks and 154 days, with a volume of 150.299K.
Key support levels were identified by orange circles, showing points of price consolidation.
The projected peak price of around $65,000 underscored the potential for significant appreciation, following established cyclical behaviors.
Bitcoin, on-chain
AMBCrypto’s look at Coinglass’ data showed notable spikes in Bitcoin liquidations around late February, early April, and late June.
These spikes coincided with fluctuations in Bitcoin’s price, indicating periods of high volatility and intense market activity.
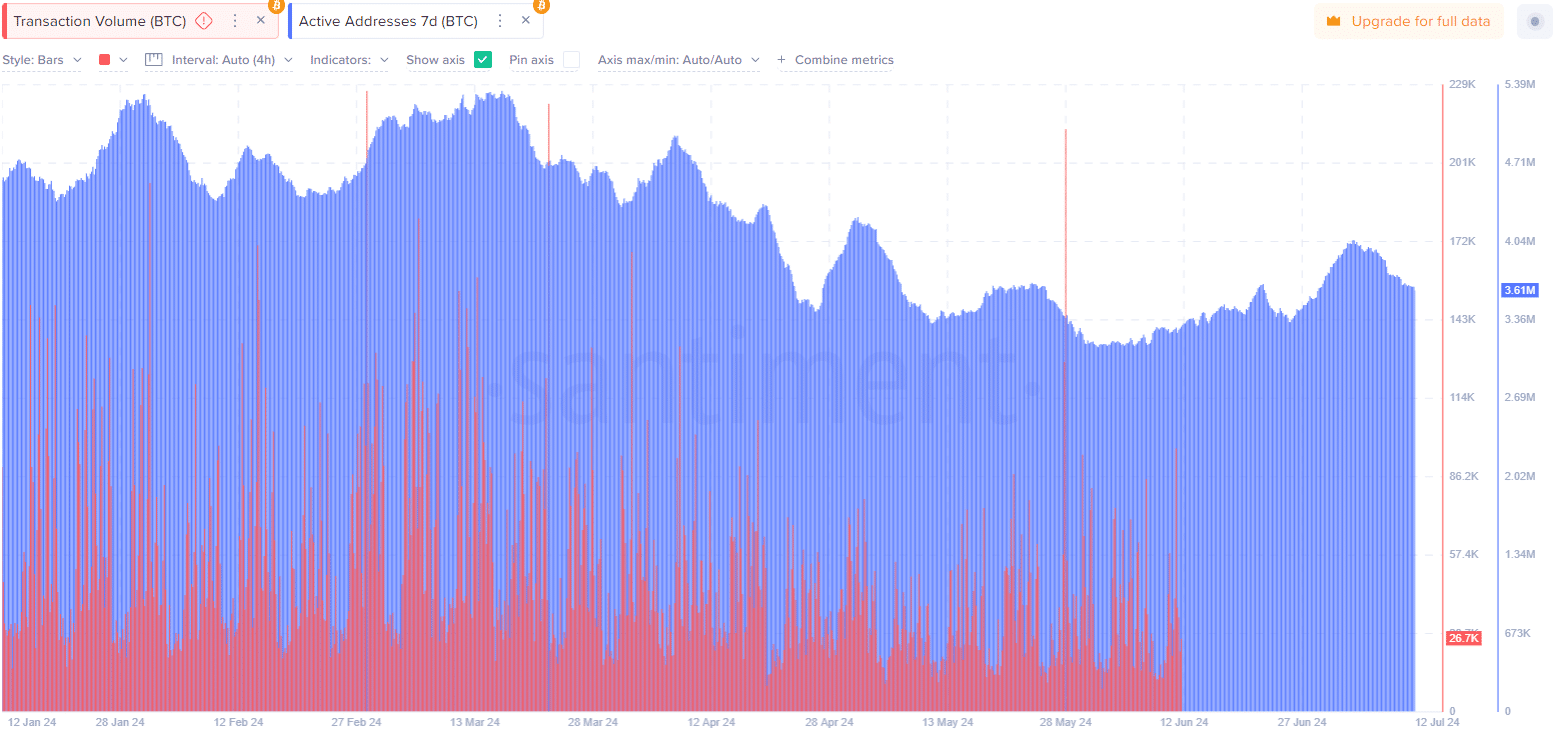
Additionally, there has been a general trend of increasing active addresses, peaking around late March and gradually declining thereafter.
Transaction volume also exhibited significant spikes, especially in early April and mid-June, suggesting periods of heightened trading and network activity.
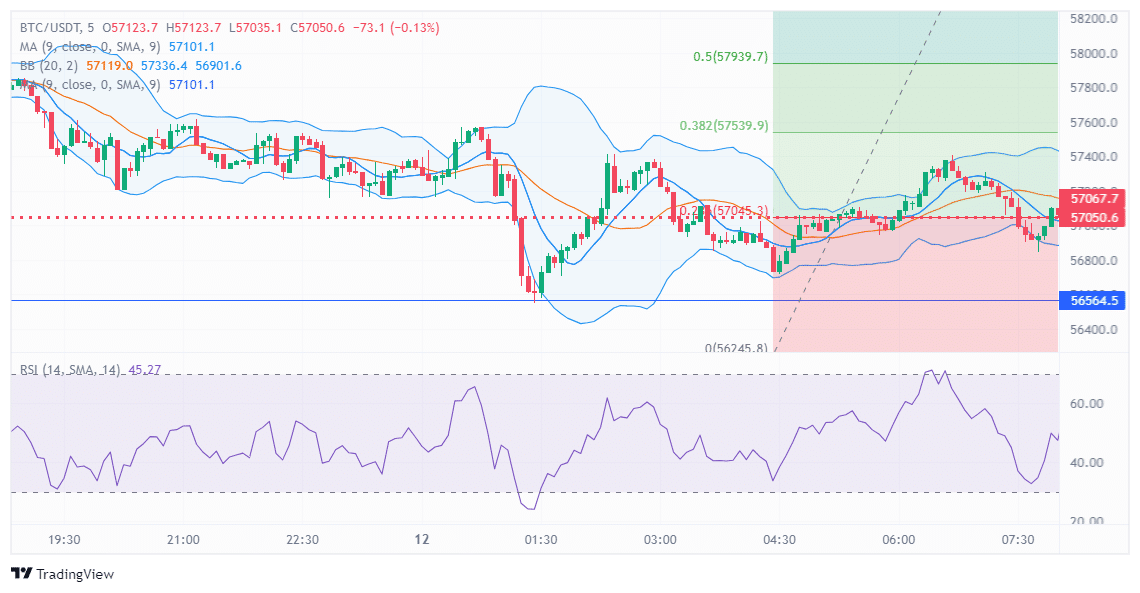
Meanwhile, the 9-period Simple Moving Average (SMA), at 57025.1, acted as a dynamic resistance or support level, with price action fluctuating around it, highlighting its relevance in short-term trading decisions.
Bollinger Bands, with 20 periods and two standard deviations, showed the price encapsulated, suggesting periods of high and low volatility.
During a sharp decline to 56245.8, the bands widened, indicating increased volatility, and have since slightly contracted as the price stabilizes around 57008.4. This indicated potential breakout or consolidation phases.
As of press time, the RSI with a 14-period setting stood at 46.84, indicating neutral momentum close to the 50 level.
It had dropped significantly during the price fall, reflecting bearish momentum but has shown some recovery, suggesting potential stabilization.
Fibonacci retracement levels from the recent high of 57939.7 to the low of 56245.8 highlighted key resistance levels during price recovery, with 0.236 at 57045.3, 0.382 at 57539.9, and 0.5 at 57939.7.


