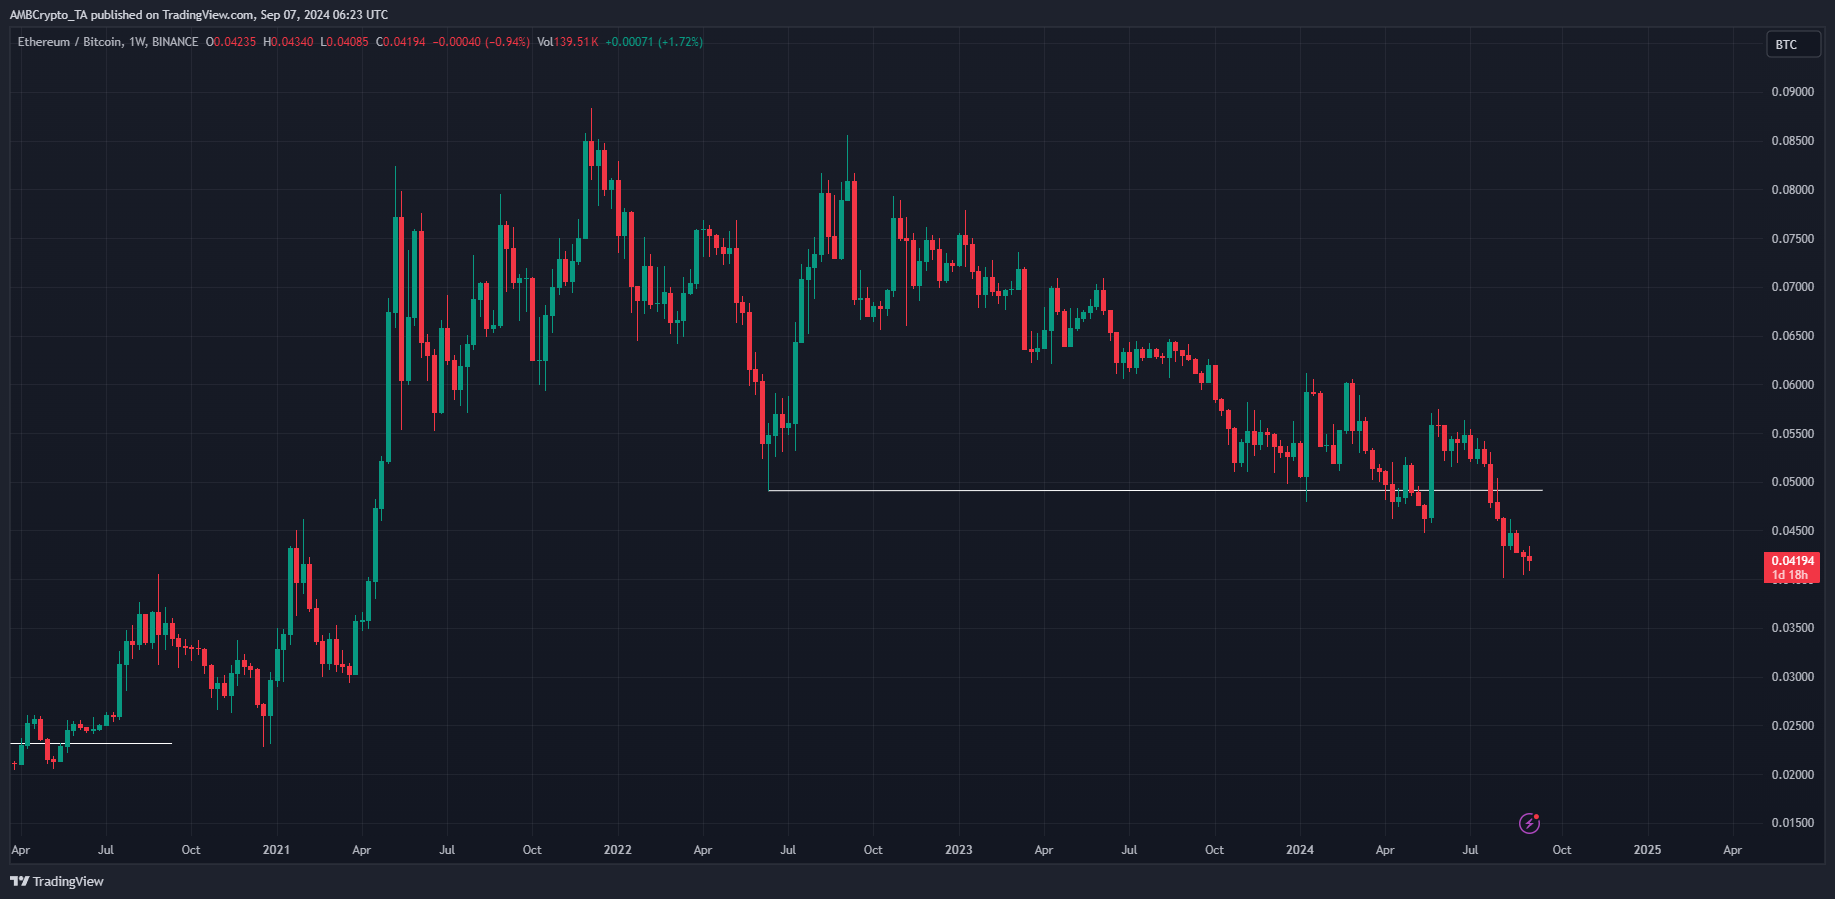
Ethereum’s weekly chart against Bitcoin showed that the downtrend has been in play since early 2023.
- The $2.6k support zone was decisively broken over the past two weeks
- Ethereum sellers’ consistent dominance has investors worried
Ethereum [ETH] formed an ascending triangle pattern on the higher timeframes. The 16.6% drop from Tuesday to Friday was still within this bullish pattern and suggested that long-term investors can be hopeful of recovery.
Ethereum has not been against Bitcoin [BTC] which traditionally leads the crypto market. This inability to match BTC’s performance is a frustration for investors. The recent 1000 ETH sale by the Ethereum Foundation did not bolster sentiment either.
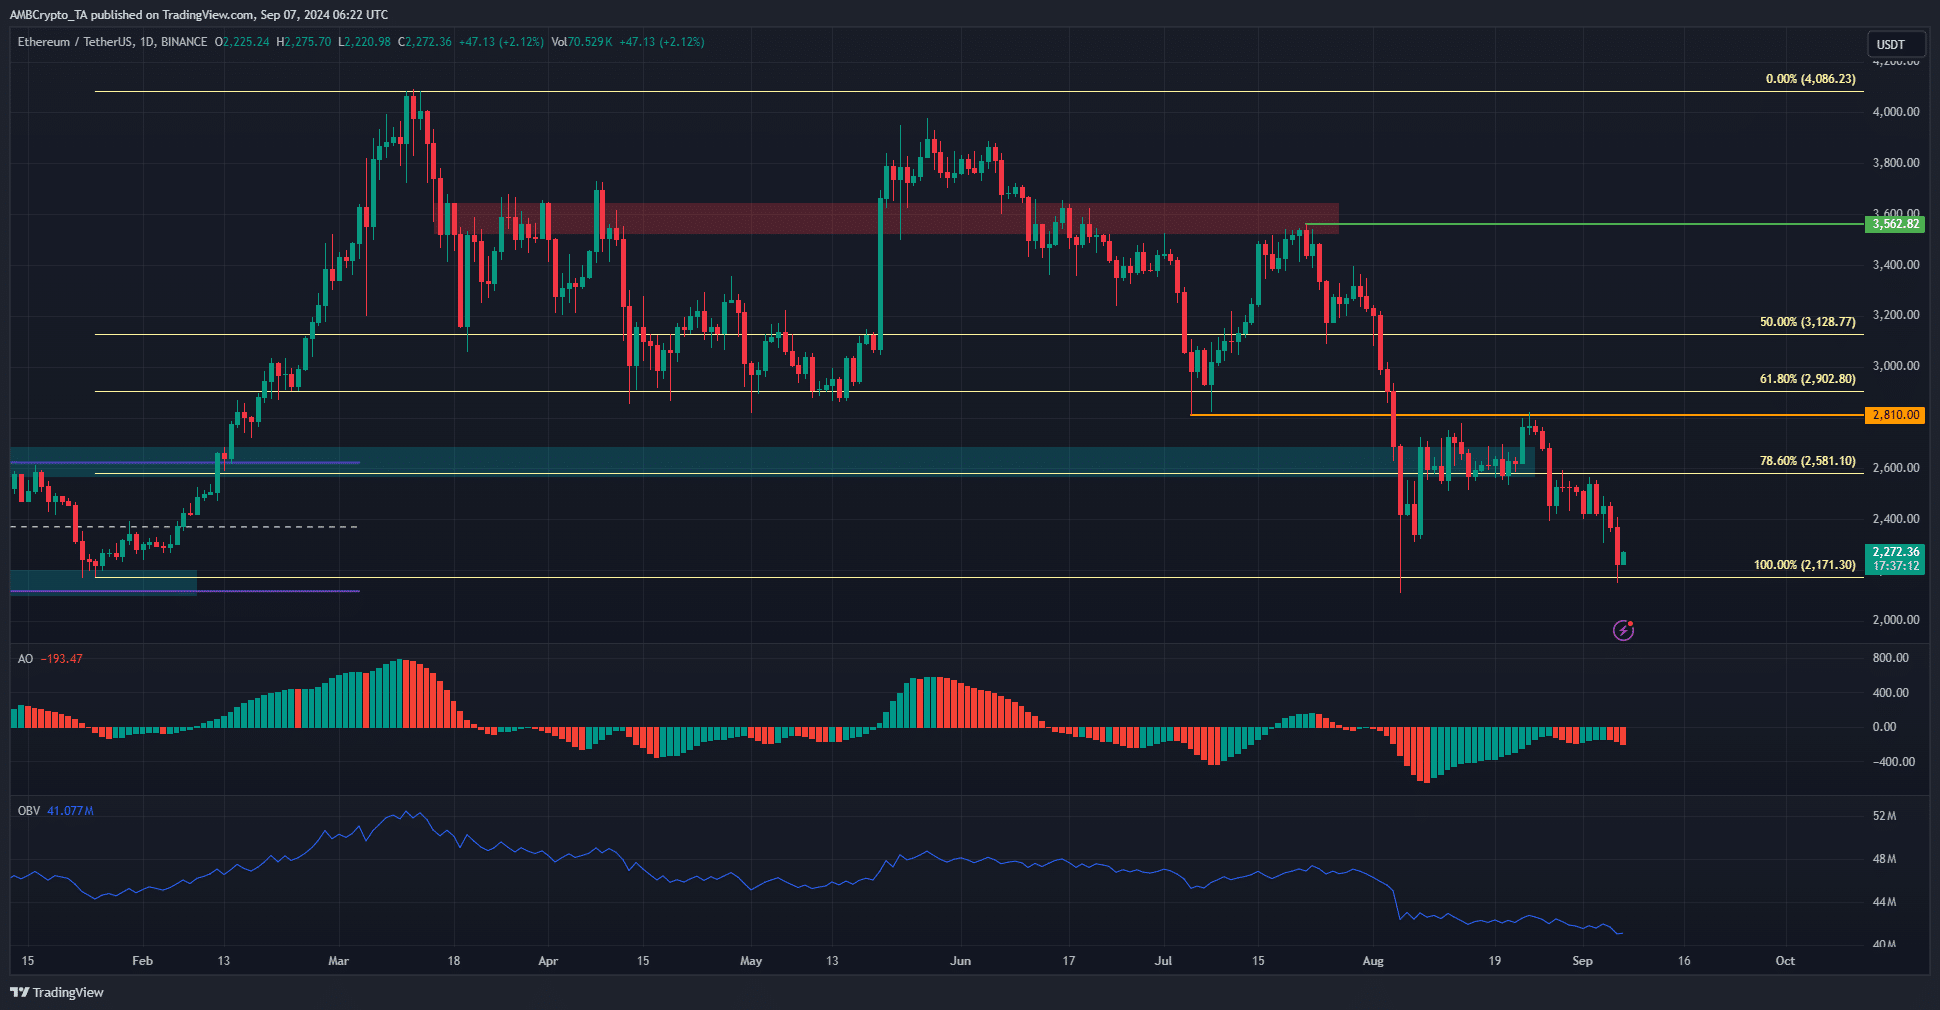
Daily wick from early August has been filled
The rally in February has been wholly retraced. The losses in the second half of July saw the $2171 zone tested, and it was retested on Friday, 6 September, again.
The Awesome Oscillator showed red bars on the histogram beneath zero to signal strong bearish momentum. The bearish side has been dominant since early August and has not relinquished its grip.
The OBV was also on a downtrend to reflect steady selling pressure. Two weeks ago, the price of ETH was above $2.6k and there was some hope that recovery was at hand.
Alas, since then, the support zone which was the range high in early 2024 has been decisively broken. Hence, further losses appeared likely given the sellers’ dominance.
Ethereum vs Bitcoin also reflected weakness
The weekly chart of Ethereum against Bitcoin revealed that the downtrend has been in play since early 2023. The 2022 low at 0.056 was breached in 2024, and ETHBTC continued to trend downwards on the charts.
Ethereum’s weak performance also brought worries that the altcoin market might struggle during this run. The older coins will have an especially hard time grabbing the attention of the new capital influx into the market. Especially if and when a bull run gets underway.

